Comparison Charts
There are 2 ways to compare more than one dataset on a comparison chart.
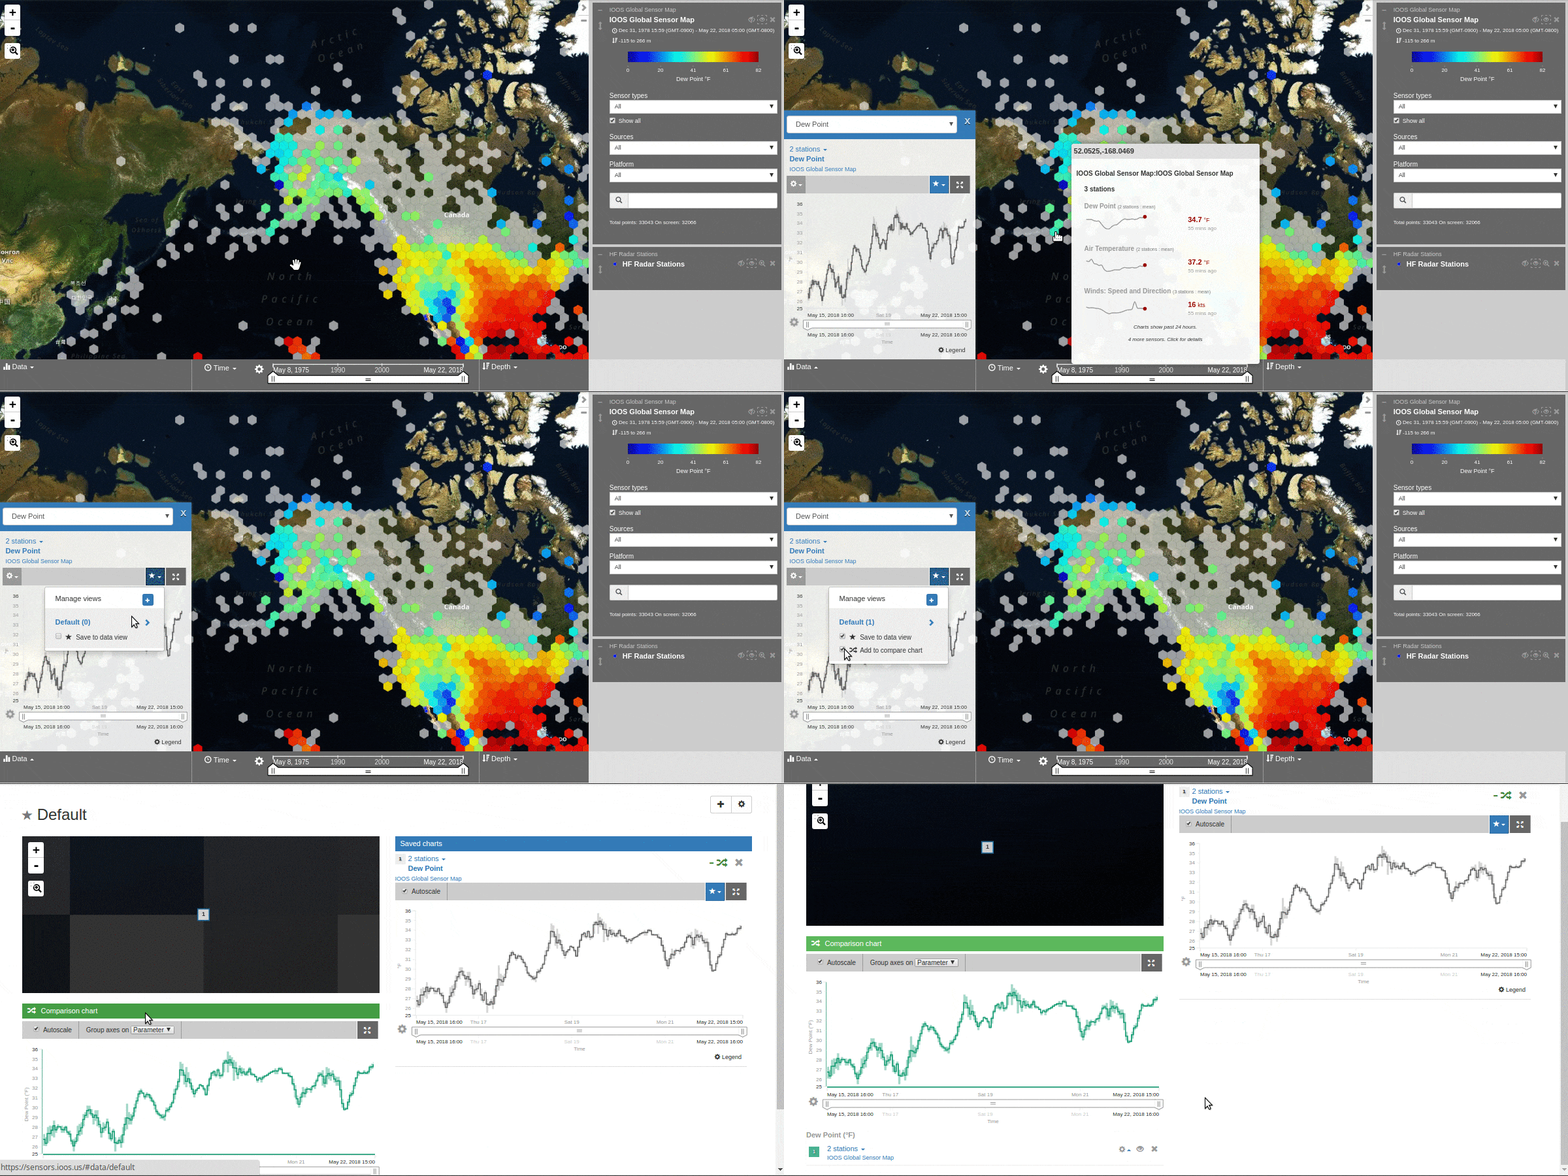
Within the data chart
Click the
 in the data display window.
Click in the
Save to data view boxunder your view’s name.Click the
Add to compare chartbox.The new data will appear in the comparison chart in a contrasting color, and the name of the data layer will also be added to a list below the comparison chart.

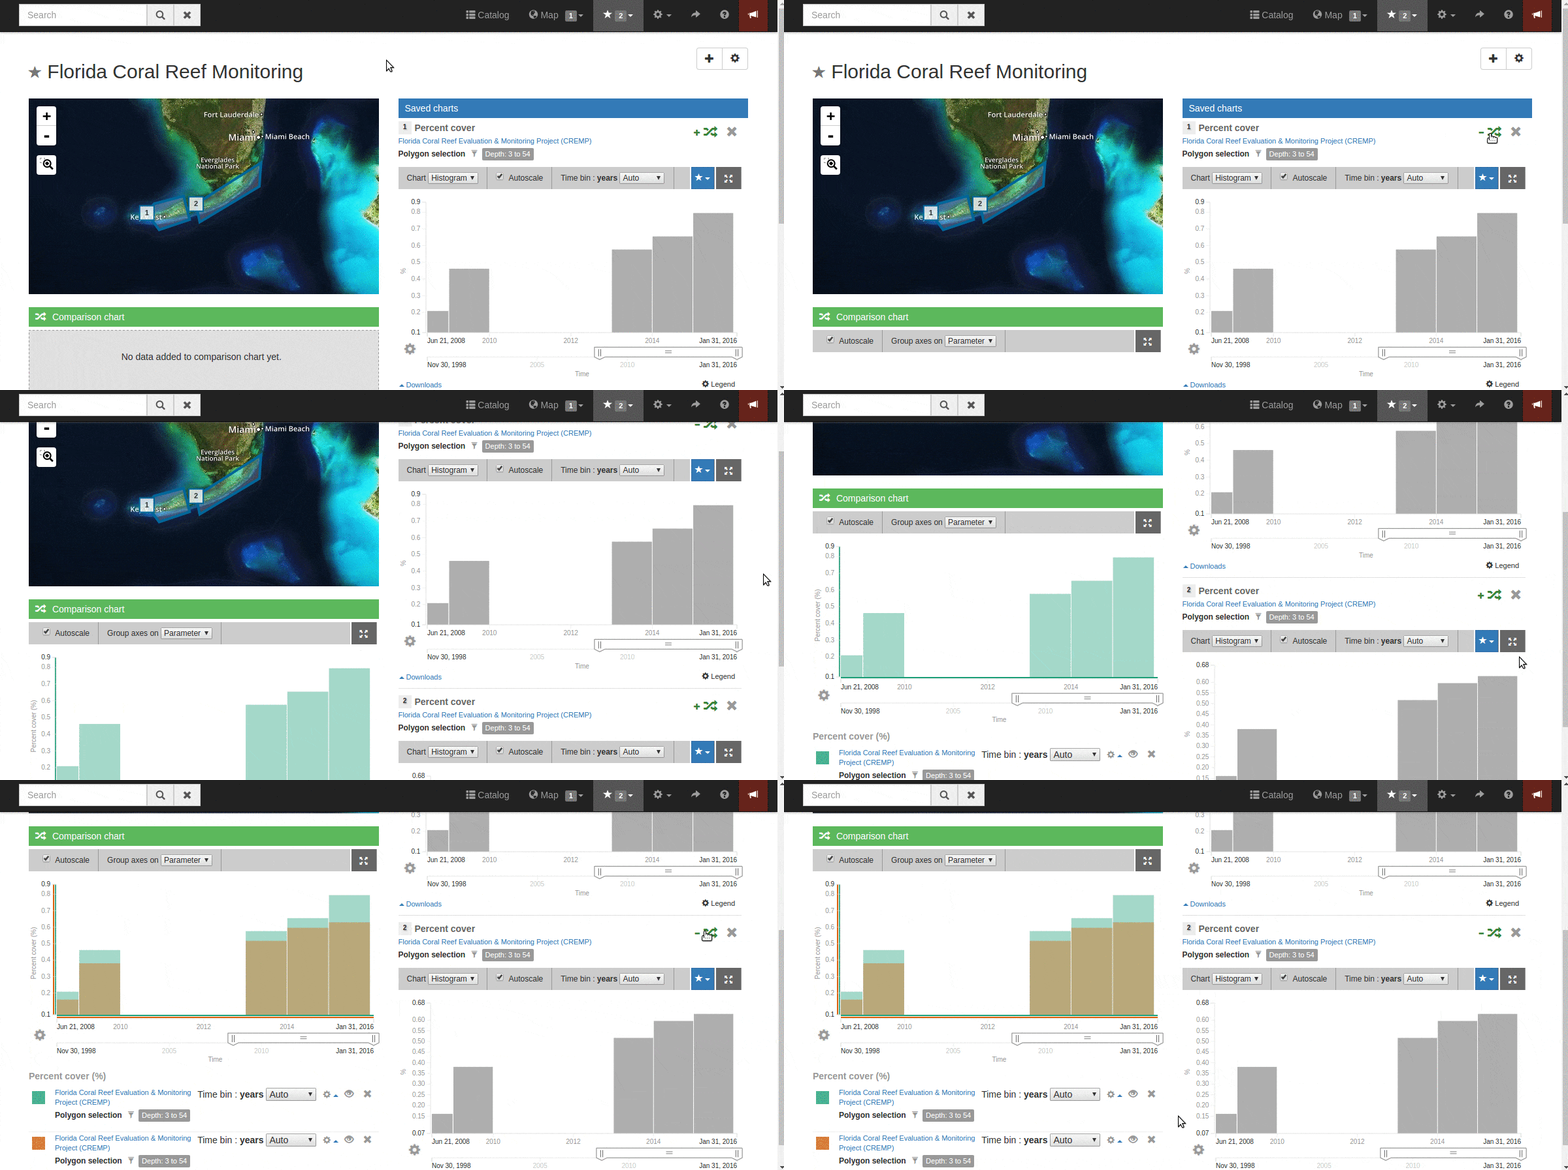
Within the data view
With the data view open, on the right hand side find the individual chart that you want to add to a compare chart.
Click the add to chart
 icon, in the upper right hand corner of the data chart.
This icon can also be used to remove a dataset from the comparison chart.

For more information, please see the Data Views section.